Over the past 25 years, the annual Esri GeoConX Conference has become the largest annual geospatial event in the electric, gas and telecommunications industries. At the event, professionals and Esri users from both industries converge to network, collaborate, and learn as a larger, unified community. This year the conference occurs in Chicago, from September 5-8th.
This year’s conference focuses on how attendees can employ the latest GIS technology to break barriers—from business and technical barriers, to communications and information barriers. While attendees explore products and services with familiar faces on the expo floor, they’ll also discover a lineup of emerging businesses.
The Esri Startup Zone at GeoConX features five Esri Emerging Partners that introduce innovative GIS solutions for electric and gas utility challenges. Be sure to make time to visit these companies!
EXHIBITING STARTUP PARTNERS:
| Company | Description | Booth |
| Aerial Insights | Artificial Intelligence powered solutions for asset management and vegetation monitoring. Leverage the power of data with Aerial Insights. | Z3 |
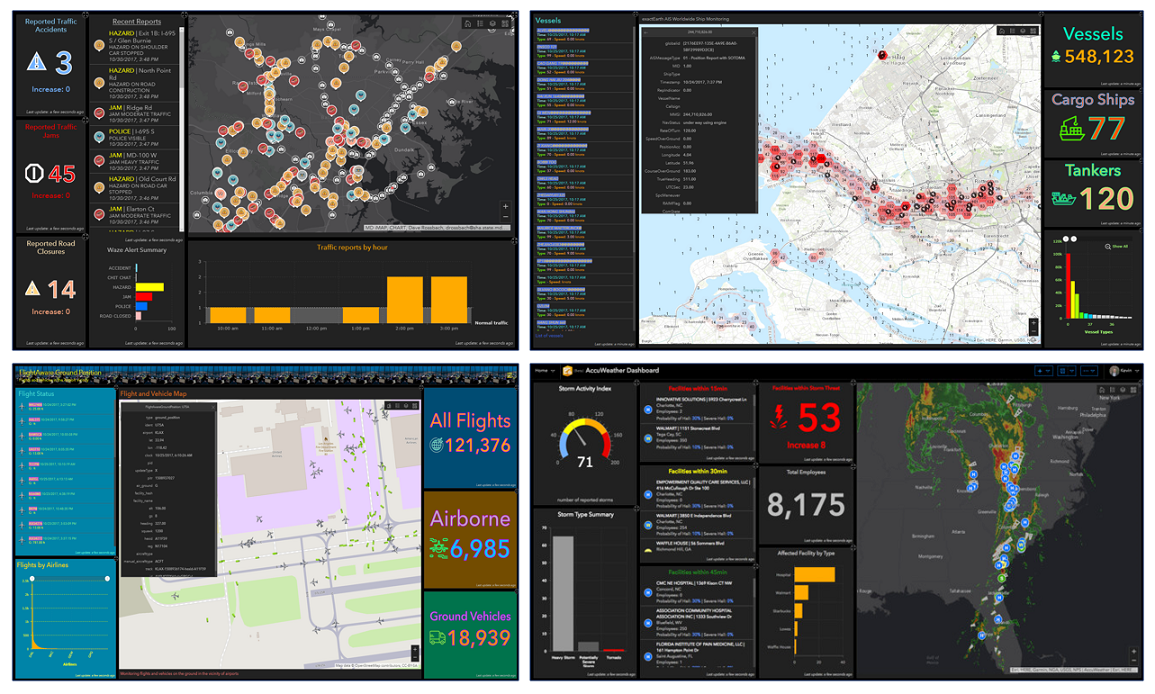
| DataCapable | Optimize emergency response and geospatial visualizations with real-time alerts. DataCapable transforms event awareness with media rich maps and social media insights. | Z1 |
| Dispatchr | Dispatchr provides a suite of adaptive cloud and mobile services that through geospatial insights, help utilities and other consumer driven organizations strengthen their fragile yet critical infrastructures. | Z5 |
| Groundvu | GIS requires high quality, reliable, rapid delivery of ArcGIS ready data. At GroundVu, we fly and drive your assets, using cameras to create 3D GIS. | Z2 |
| Meemim Inc. | The world’s first, Meemim vGIS is the mixed-reality GIS visualization application that delivers real-time holographic visualization of underground pipes, valves, cables and other utility objects. | Z6 |

About the Esri Startup Program
The Esri Startup Program is a free three-year program that gives emerging businesses the tools to build mapping and location analytics capabilities into their products. Qualifying startups receive cloud services, software, training and support, content, and other opportunities to help them succeed.
“Esri is committed to the startup community,” said Kurt Daradics, Esri’s Startup Program Manager. “We understand the challenges that emerging businesses face to quickly bring products to market and developing customers. Startups have been transforming our culture and this extends into the enterprise. Esri utility and telecom startups are delivering innovative solutions with intuitive interfaces that extend the value and power of the ArcGIS platform.”
For DataCapable, “Esri’s Startup Program is all about collaboration” said Peter DiSalvo, DataCapable’s Co-Founder and CTO. “The modern utility needs to actively monitor and engage their customers at all levels. Being part of GeoConX is an opportunity for us to share our integration with ArcGIS Online and enable existing Esri utility customers to maximize the value of their current GIS investments.”
Learn more about GeoConX: esri.com/geoconx.


 Have you ever received files containing coordinates in Military Grid Reference System (MGRS) or United States National Grid (USNG) format and wondered… “what now?